

[Draft article to be published in the January/February 2025 (Volume 37, Issue 1) of Assessment Update]
Data Science for Assessment
David Eubanks and Scott Moore
Introduction
Assessment and institutional research offices have too much data and too little time. We have ideas for research that go unexplored because the churn of standard reporting leaves little room for creativity. Often, when we create a report, the response is “this is great, but can you add a new column to separate out first generation students?” Exacerbating the problem is the general expectation that once a report is created, it can be updated periodically. This accumulation of expectations can feel like being in a leaky rowboat, where most of the time we’re just bailing water rather than making way. There is a way out of this cycle. The solution is equal parts technique and philosophy. The first is the easiest, to modernize our data work.
Tell, Don’t Do
Tools like Excel are transactional: we click or type in an interface and a single operation occurs, like renaming a column or deleting a row. The second time we want to rename the column or delete rows, it takes the same amount of time as it did the first time. Such row and column operations are the building blocks of reports, and there can be dozens or hundreds involved for a large report and can include more complex tasks like merging multiple data sources, which are slow and awkward in Excel.
The problem with transactional tools is that they don’t allow us to efficiently iterate: to quickly try out variations of an analysis so that we can explore patterns in pursuit of meaning. We can gain the ability to iterate through the automation of the analytical building blocks of reports: those same row and column operations. The goal is to speed up the production of reports by writing them only once and then using that template to automatically produce future ones. To do that we use a descriptive rather than transactional tool for data work.
The descriptive version of the building blocks of data work is a set of written instructions for row and column operations. There are many choices for a scripting language to do that, but we recommend R and the tidyverse package, which is intuitive to use, quick to learn, and free. An example is shown below with comments on the right. 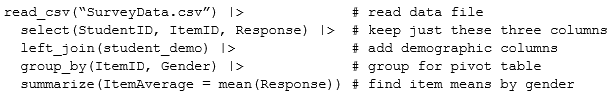
The example shows a typical step in a report on survey data. It is read top to bottom, with the “|>” at the end of each line “piping” the results of one step to the next, like an assembly line. The short script describes reading in a data file, selecting the columns we want to work with, joining it to associated student information, and creating a pivot table by item and gender to compute item averages. We could just as easily compute item distributions. With a little extra effort, we could plot them as histograms or run a regression analysis.
Once a script is written and has been tested, it runs nearly instantaneously. That means the next time we want to run the report, we can spend time improving it by adding new features instead of redoing all the same work as we would with a transactional tool like Excel or SPSS. This unlocks the superpower of iteration, which is essential to doing science. As a bonus, it creates a transparent and reproducible workflow for data analysis, so when we inevitably have validity questions, we can find out where the problem is.
To learn enough of this descriptive language to be productive takes a couple of months for most people, in our experience. The resulting time savings allows more data operations to be automated, creating a virtuous cycle of freeing up time and learning more advanced features of the language. The result is a transformation of how we work. It’s not just a matter of producing reports a hundred times more quickly; the iteration superpower unlocks the freedom to try out ideas, including ideas from the broader research community. This powerful combination of features allows us to become data scientists instead of bilge pumps. Which leads to the philosophical transformation: what do we do with these superpowers?
Think Again
Imagine this scenario: a vice president at your institution reads a report showing that learning outcomes averages are lower for commuter students than for residents. She thinks that this is because commuters have fewer social opportunities and convinces the cabinet to budget for new programming for those students. Two years later, the data isn’t showing any change, but the vice president thinks something’s probably wrong with the data and finds some anecdotes to advertise the value of the initiative. What, if anything, has gone wrong here?
Data work is usually in the service of (1) knowing what is the case, (2) making an educated guess about cause and effect, and (3) recommending actions that could improve the situation. You’ll recognize that list as a rephrased assessment cycle. But from the perspective of report-writing we can lose sight of the grandeur of the project: we want to perceive the nature of reality so that we can manipulate it to our ends.
Millenia of philosophy and science suggest that this isn’t an easy project, and there was little progress on it until about the 18th century (Newton’s Principia was published in 1687). As detailed in Steven Shapin’s The Scientific Revolution, moving to a more accurate understanding of reality means changing our minds about what is real, which is difficult for anyone, but especially difficult for those with authority and a reputation to protect.
Data science is big business, and Benn Stancil is an insider who shares his thoughts on the state of the industry at benn.substack.com. In one piece he writes about the role of analysts in Kanneman’s framework of Type 1 / Type 2 thinking, roughly translating as our deeply-held intuitive understanding of reality versus rational analysis using data and calculation. Most data analysts produce Type 2-oriented products: charts and tables of numbers, perhaps with some inference about meaning. Stancil argues that what we should be doing is trying to affect Type 1 thinking: the deeply held, often unanalyzed ways we assume the world is organized.
In the hypothetical example above, the vice president concluded from the initial report that commuters were underperforming academically, but the why question was left unanswered. That epistemological vacuum invites an explanation from the latent Type 1 system in place (“commuter students do worse because they don’t benefit from the residential student experience”). The problem is that by leaving out an analysis of causes, we surrender to existing Type 1 models of the world and have no lever to move those pre-existing beliefs. If the original report had included explanatory variables, it might have concluded that the commuter population had a different socio-economic profile and lower quality high schools than residents, and that this might be the cause of the gap. This doesn’t necessarily override the report-readers Type 1 system, but at least has a chance to introduce some beneficial doubt. Once the institution has committed money and reputation to a project, the opportunity has been lost. This doubling-down on beliefs can result in new information being ignored if it contradicts the existing thinking. This phenomenon is detailed in books like Adam Grant’s Think Again and Julia Galef’s The Scout Mindset. The latter is particularly useful for the aspiring data scientist. As a practical matter, it’s important to cultivate relationships with campus leaders, to understand the existing Type 1 beliefs and anticipate where opportunities to update them might be.
Analyzing causes is fraught with problems, which is why science proceeds slowly, and sometimes backtracks. It’s imperative that a data scientist be part of a larger research community to share and test new ideas about causal relationships.
Implications for Assessment Offices
Most current assessment work is not data science, so it makes sense to specialize that work. An office may have multiple staff working with faculty, and a data scientist role placed either in the office or perhaps with institutional research. Directors should be aware of how to hire for this role and develop its potential. The technical skill needed is the ability to learn a scripting language like R/tidyverse, and to know enough statistics to get started. You’ll need advanced regression methods to analyze causes, but that can be learned on the job.
For directors, the role might include the technical part of data science but need not. More important is the leadership role of understanding the Type 1 / Type 2 distinction as we’ve described it here, and to develop the relationships that facilitate the updating of beliefs. This is a big responsibility, because we never have perfect data, identifying causes is virtually impossible under the conditions of educational research, and leaders don’t change their minds easily. We want to be intellectually honest (i.e. not ignore what the data is telling us), but there are political and personal limits to how much of that an administration can take before they just switch off. We must be modest in our claims, but forceful enough to nudge Type 1 systems into line with the data. To make the task tractable, it’s essential to be a participant in the larger research community; none of us can do all the work ourselves, and none of us have a monopoly on good ideas.
One of the benefits of modernizing data science within an assessment office is that it makes us particularly valuable within higher education, with skills that transfer to other industries if we want to switch. We can find jobs, get raises, and have a rich professional network to facilitate both. Best of all is the satisfaction that the work can have a significant and lasting effect on students.
David Eubanks, Assistant Vice President for Assessment and Institutional Effectiveness, Furman University; and Scott Moore, Independent Consultant for Leaders in Higher Education, Palmetto Insights.